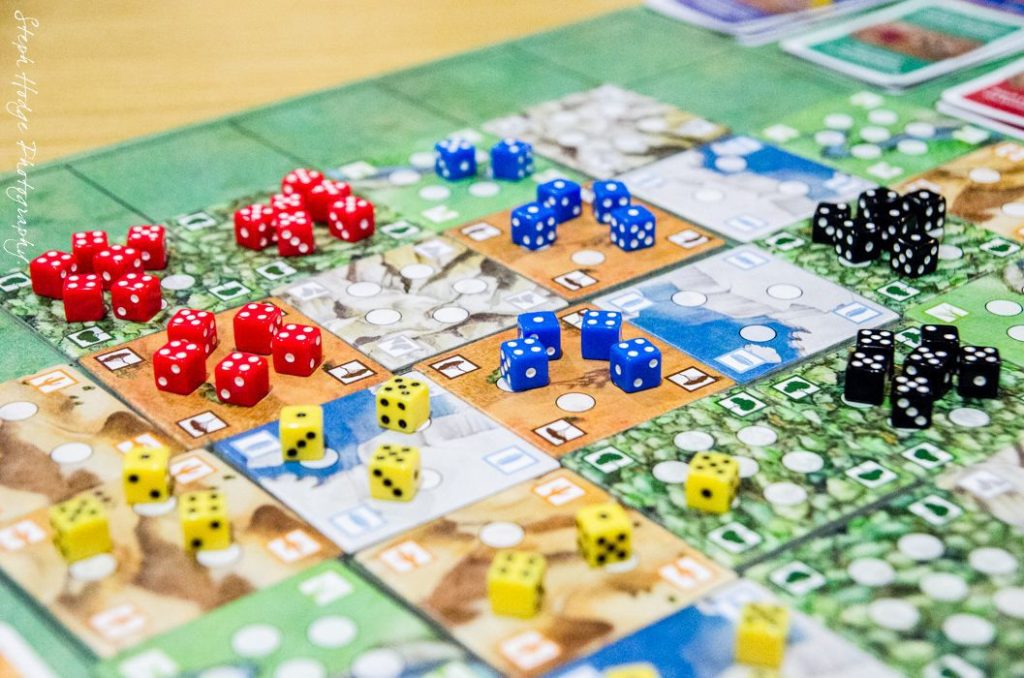
(The exercise delves into the nuanced connections between demography, distribution patterns, and genetic diversity. This curriculum provides the opportunity to also incorporate computer demographic and genetic simulations (optional). This activity looks at the role of habitat structure and stability on genetic variation across a landscape.
Activity time: 3 hr (can be split among several periods)
Game: Biosphere
Associated materials: paper- ‘What really is Evolution?’, paper- ‘Simulating evolution: how close do computer models come to reality?’, paper-“Population Genetics and Demography Unite Ecology and Evolution”
Main materials: Link
Game modifications
- Print glacial tiles (preferably on card stock) and gather 16 small pebbles or stones (‘Main Materials’ link). NOTE: Alternative to printing anything. Use pebbles and coins as markers to denote moraines (former sites of glaciers) and glaciers, respectively. If using pebbles and coins, remember that the carrying capacity of each glacial tile = 1.
- In Game 2, also use the two new goals (in place of two cards normally selected).
- The lifespan for glaciers matches polar biome value.
Game play modifications for all plays
- Select 2 Habitat Points (= increased lifespan) at the game start in ANY habitat, this speeds up the early game progression
- Select goals non-randomly so that all are biologically relevant (& do not use purple goals)
- IGNORE TIE BREAKER TRACK- DO NOT DISCUSS
- All tiebreaker points go into EP bank
- If there is a tie, the number of EP points are the tiebreaker
- Use our biome lifespan cards (vs. ‘Elelphant graveyard’ dial) provided in the ‘Main Materials’ link.
Activity
- Assign and discuss primary literature that matches the learning objectives (see above for suggestions).
- Play the game following the two glacier scenarios as described below.
- Run computer simulations that match both game scenarios.
- After finishing, use homework questions as an outline to lead a class discussion. We also recommend assigning them as homework. Using them as a framework for discussion allows a freer, more organic exploration of the learning objectives and their ties to the gameplay. The homework promotes deeper self-reflection on all the questions. Really- that is it.

Details
GAME 1
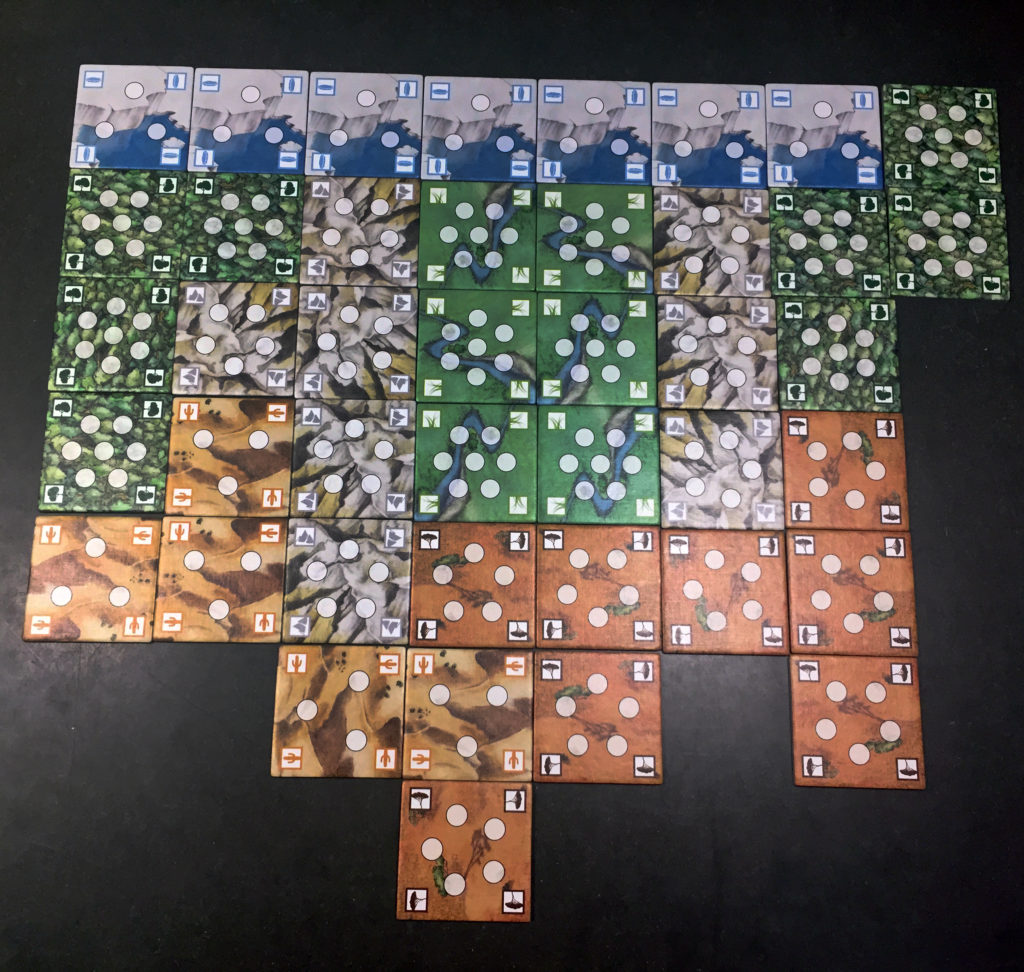
1. Step-up Biosphere map to match the map below:

2. Play according to the publisher’s rules unless noted above.
GAME 2

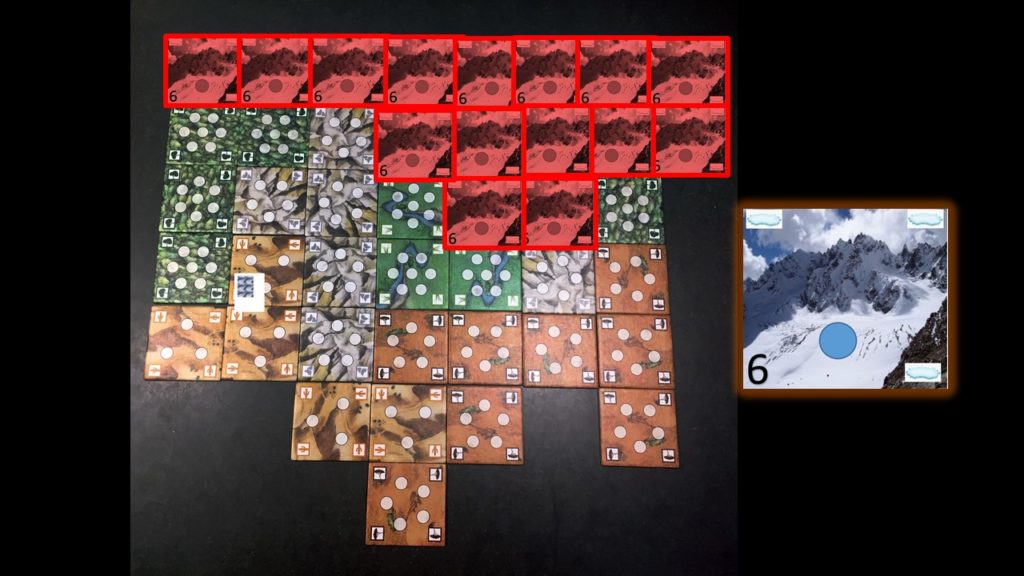
Figure 2. Glacial maximum extent depicted by placing glacial tiles (or other makers) on red squares.
- Step-up Biosphere map to match Figure 1.
- Add glacial tiles (or coins) to the tiles highlighted in red in Figure 2. Again if using coins. Remember that glaciers can house only 1 population.
- The gameplay is normal for the first two rounds.
- At the start of the 3rd round, during the end of Phase 1, the glacier will start to recede. To do this, remove all glaciers from the lowest latitude (row) where they are present. Place a pebble or any distinct marker to denote that a glacier was there and deposited a moraine. Each subsequent round, continue to remove a row of glaciers and leave moraines until all glaciers are removed.
- Play according to the publisher’s rules unless noted above.
Computer Simulations (optional)
We provide the software for Windows. However, a Linux and OSX version exists at www.splatche.com. Download and copy to the base folder (step 2)
A demographic simulation with glaciers
- Unzip folder ‘biosphere_simulations’
- Open folder ‘1_demographic_genetic_simulations’
- Double click ‘Splatche2-01_win_graphical.exe’
- Click ‘Open settings’ button and select the file: ‘Biosphere_settings_v2_US_dynamic_glacier.txt’
- Click ‘Build World’
- Then click ‘Run’
- Wait for demographic simulation to finish. When finished go to the ‘output’ window and move the slider bar back and forth to see how the species’ demography changed through time.
The click ‘Coalescent Simulations’ tab and click ‘Do Simulations!’ button.- Open new settings ‘Biosphere_settings_v2_US_no_glacier.txt’ and repeat steps 5-8.
- Now go to base folder of ‘biosphere_simulations’ and open folder ‘2_calculate_pop_gen_stats’
- Look for a file: ‘GENETIC.RESULTS.tsv’, IF IT EXISTS, delete it.
- Copy from ‘\1_demographic_genetic_simulations\Biosphere\GeneticsOutput’ the following two files: ‘Biosphere_settings_v2_US_no_glacier_GeneSamples_1.arp’ ‘Biosphere_settings_v2_US_dynamic_glacier_GeneSamples_1.arp’to the folder: ‘2_calculate_pop_gen_stats’, overwrite existing files
- Double click ‘__edit_and_click_this.bat’
- After this is finished, open: ‘GENETIC.RESULTS.tsv’
- Line 1 contains the genetic summary statistics for the ‘glacier’ scenario
- Line 2 contains the genetic summary statistics for the ‘no glacier’ scenario
- Note if there are more than 3 rows of data in the ‘GENETIC.RESULTS.tsv’ – delete this file and run ‘__edit_and_click_this.bat’ file again.
Questions
- How did the presence of dynamic biomes affect completion of the game’s goals?
- Which game was faster, why was this?
- How did the presence of glaciers affect the demographic portion of the simulations (the visualization at step 7)?
- How did the presence of glaciers affect the genetic diversity at each of the six sites? Were there apparent genetic differences between the two scenarios? Which sites were most different? Why?
- How is genetic diversity tied to the configuration and stability of biomes? Explain.
A deeper dive into the computer simulations:
Explore how changes in carrying capacity, migration rate, growth rate, genetic parameters. Open any of the files below in a text editor and tweak the values (see first line for explanation of values)
To change:
**habitat specific carrying capacity- edit values in: ‘/Biosphere/carrying_capacity.txt’
**migration rate, growth rates: see Splatche GUI
**change population source of demographic models – edit coordinates in: ‘/Biosphere/Arrival_cell.col’
**change cells to sample genetics: ‘/Biosphere/GeneSamples.sam’
**genetic parameters (number of loci, per generation recombination, per site mutation rates and transition rate): ‘/Biosphere/genetic_data_SEQ.par
